The code in its entirety is shown at the end of this page. You should click on the Download Project Bundle button in order to get the fonts and libraries used by the code.
Ensure your PyPortal is plugged into your computer via a known good USB cable. The PyPortal should show up as a flash drive called CIRCUITPY.
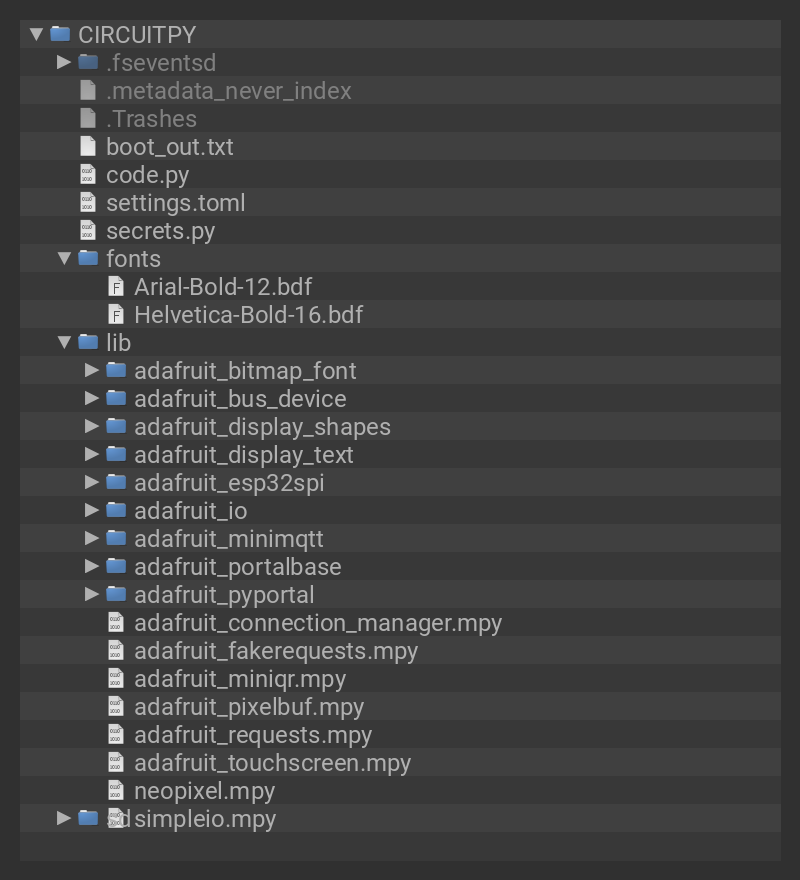
Open the zip file and copy all the files listed below to CIRCUITPY.
- code.py
- fonts
Note: The boot_out.txt file you may see on the CIRCUITPY drive is generated by CircuitPython and is not part of the needed files for this project.
Before the functional code, there's some setup to be done. There are constants setting some parameters for the display of the bar graph.
MAX_BAR_HEIGHT defines the height of the tallest bar. The highest value bar will always be this tall, and the height of shorter bars are computed relative to this. MARGIN is the amount of space to either side of the bars, while SPACE_BETWEEN_BARS sets the number of pixels between adjacent bars.
COLORS sets the color for the UV values 0-14. 0 is basically night with no UV radiation. And 14... well you remember that comment about crispy bacon? Each bar is colored as determined by its UV Index value. Low values are green, going through yellow and orange as it gets higher, to red and eventually into violet for very high values.
After COLORS are definitions of the different fonts used and the URL from which to fetch the US EPA data.
MAX_BAR_HEIGHT = 160
MARGIN = 10
SPACE_BETWEEN_BARS = 1

COLORS = [0x00FF00, 0x83C602, 0xa2CF02,
          0xF7DE03, 0xF6B502, 0xF78802,
          0xF65201, 0xEA2709,
          0xDA0115, 0xFC019E, 0xB548FF,
          0x988FFE, 0x7EA7FE, 0x66BFFD, 0x4BD9FF]

cwd = ("/"+__file__).rsplit('/', 1)[0]

CAPTION_FONT_FILE = cwd+'/fonts/Helvetica-Bold-16.bdf'
BAR_FONT_FILE = cwd+'/fonts/Arial-Bold-12.bdf'

#pylint:disable=line-too-long
url = 'https://enviro.epa.gov/enviro/efservice/getEnvirofactsUVHOURLY/ZIP/{0}/JSON'.format(secrets['zip'])
#pylint:enable=line-too-long
The JSON returned by the EPA's API has the form:
[
{
"ORDER": 1,
"ZIP": 20050,
"DATE_TIME": "AUG/09/2019 07 AM",
"UV_VALUE": 0
},
{
"ORDER": 2,
"ZIP": 20050,
"DATE_TIME": "AUG/09/2019 08 AM",
"UV_VALUE": 1
},
...
]
Each record has an ORDER value which seems to be redundant, an echo of the zipcode provided in the query, the data and time for the value, and the UV value. For our purposes we only need the date, time, and value.
The value is just a number which may be used as is. The date and hour need to be separated since we want the date for the screen header and the hour to label each bar.
To extract the hour, the code splits the DATE_TIME value at spaces. This gives 3 pieces: the date, the hour, and an 'AM'/'PM' suffix. Any leading '0' is removed and the hour and suffix are joined using a newline so that it will be split over two lines. This is needed due to the limited width below the bars.
def extract_hour(date_time):
"""Extract the hour in a format to use for display:
:param date_time: the timestamp from EPA UV readings
"""
split_date_time = date_time.split()
hour = split_date_time[1]
suffix = split_date_time[2]
if hour[0] == '0':
hour = hour[1]
return '\n'.join([hour, suffix])
Getting the date is a little easier. Since we just want the month and day, we can split the DATE_TIME value on slashes (I.e. '/') and take the first two items in the resulting array. They can be joined using a space and returned. That's something which can be used in the display header.
def extract_date(date_time):
"""Extract the date in a format to use for display:
:param date_time: the timestamp from EPA UV readings
"""
return ' '.join(date_time.split('/')[0:2])
There's not much to setting up the PyPortal instance. We won't be using the text support, and the caption will be set later. We just need to set the data URL, the background to white, and the caption font. We'll have it use the NeoPixel as a status output as a debugging aid.
pyportal = PyPortal(url=url,
status_neopixel=board.NEOPIXEL,
default_bg=0xFFFFFF,
caption_font=CAPTION_FONT_FILE)
Next we can set up the canvas for displaying the graph. We also load the font to use for the bar labels.
canvas = displayio.Group() pyportal.splash.append(canvas) bar_font = bitmap_font.load_font(BAR_FONT_FILE)
In the loop, the code starts by having the PyPortal fetch the data. There's a try-except to avoid crashing if there's any problem with the fetch or the parsing of the data returned. It can happen for various reasons, so it should be accounted for. There's nothing to be done other than note it and try again (i.e. restart the loop). After 10 minutes seems fair.
If there is good data, it can be processed into a format more easily used. The list comprehension does this. It filters out any records with a 0 value, and converts the DATE_TIME field using the extract_hour function above.
Since all the records are for the same day, the day information can be extracted from the first record (using the extract_date function above) and build the display header. That then is set as the PyPortal's caption.
Then a count of the number of readings that will be displayed. That is used to compute how wide the bars should be.
Finally finding the largest reading value. That's used below to scale the height of the bars.
json_payload = ''
try:
json_payload = pyportal.fetch()
raw_data = json.loads(json_payload)
except (ValueError, RuntimeError) as ex:
print('Error: ', ex)
if type(ex) == ValueError:
print('JSON:', json_payload)
print('Retrying in 10 minutes')
time.sleep(600)
continue
data = [{'hour': extract_hour(d['DATE_TIME']), 'value': int(d['UV_VALUE'])}
for d in raw_data
if d['UV_VALUE'] > 0]
the_day = raw_data[0]['DATE_TIME']
pyportal.set_caption('UV Index for {0}'.format(extract_date(the_day)),
(80, 20),
0x000000)
number_of_readings = len(data)
whitespace = (number_of_readings - 1) * SPACE_BETWEEN_BARS + 2 * MARGIN
bar_width = (320 - whitespace) // number_of_readings
max_reading = max([d['value'] for d in data])
Finally, is the actual display code.
It starts by removing anything that's already on the canvas.
Then it goes through each reading, computing the height of its bar and its horizontal position. That is used along with the computed bar width and the corresponding color to place a filled rectangle onto the canvas. The reading's processed hour value is placed in a Label below the bar and the value, itself, is placed in a Label near the top.
while len(canvas) > 0:
canvas.pop()
for i, reading in enumerate(data):
bar_height = (MAX_BAR_HEIGHT * reading['value']) // max_reading
x = int(MARGIN + i * (bar_width + SPACE_BETWEEN_BARS))
canvas.append(Rect(x, 200 - bar_height,
bar_width, bar_height,
fill=COLORS[reading['value']]))
canvas.append(Label(bar_font,
x=x+3, y=220,
text=reading['hour'],
color=0x000000,
line_spacing=0.6))
canvas.append(Label(bar_font,
x=x+(bar_width//2)-4, y=208-bar_height,
text=str(reading['value']),
color=0x000000))
# SPDX-FileCopyrightText: 2018 Dave Astels for Adafruit Industries
#
# SPDX-License-Identifier: MIT
"""
PyPortal UV Index display
Adafruit invests time and resources providing this open source code.
Please support Adafruit and open source hardware by purchasing
products from Adafruit!
Written by Dave Astels for Adafruit Industries
Copyright (c) 2019 Adafruit Industries
Licensed under the MIT license.
All text above must be included in any redistribution.
"""
import time
import json
import board
import displayio
from adafruit_pyportal import PyPortal
from adafruit_display_shapes.rect import Rect
from adafruit_display_text.Label import Label
from adafruit_bitmap_font import bitmap_font
try:
from secrets import secrets
except ImportError:
print("""WiFi settings are kept in secrets.py, please add them there!
the secrets dictionary must contain 'ssid' and 'password' at a minimum""")
raise
MAX_BAR_HEIGHT = 160
MARGIN = 10
SPACE_BETWEEN_BARS = 1

COLORS = [0x00FF00, 0x83C602, 0xa2CF02,
          0xF7DE03, 0xF6B502, 0xF78802,
          0xF65201, 0xEA2709,
          0xDA0115, 0xFC019E, 0xB548FF,
          0x988FFE, 0x7EA7FE, 0x66BFFD, 0x4BD9FF]

cwd = ("/"+__file__).rsplit('/', 1)[0]

CAPTION_FONT_FILE = cwd+'/fonts/Helvetica-Bold-16.bdf'
BAR_FONT_FILE = cwd+'/fonts/Arial-Bold-12.bdf'

#pylint:disable=line-too-long
url = 'https://enviro.epa.gov/enviro/efservice/getEnvirofactsUVHOURLY/ZIP/{0}/JSON'.format(secrets['zip'])
#pylint:enable=line-too-long
def extract_hour(date_time):
    """Extract the hour in a format to use for display:
    :param date_time: the timestamp from EPA UV readings
    """
    split_date_time = date_time.split()
    hour = split_date_time[1]
    suffix = split_date_time[2]
    if hour[0] == '0':
        hour = hour[1]
    return '\n'.join([hour, suffix])
def extract_date(date_time):
    """Extract the date in a format to use for display:
    :param date_time: the timestamp from EPA UV readings
    """
    return ' '.join(date_time.split('/')[0:2])
pyportal = PyPortal(url=url,
                    status_neopixel=board.NEOPIXEL,
                    default_bg=0xFFFFFF,
                    caption_font=CAPTION_FONT_FILE)
canvas = displayio.Group()
pyportal.splash.append(canvas)
bar_font = bitmap_font.load_font(BAR_FONT_FILE)
while True:
json_payload = ''
try:
json_payload = pyportal.fetch()
raw_data = json.loads(json_payload)
except (ValueError, RuntimeError, ConnectionError, OSError) as ex:
print('Error: ', ex)
if isinstance(ex, ValueError):
print('JSON:', json_payload)
print('Retrying in 10 minutes')
time.sleep(600)
continue
data = []
for d in raw_data:
if d['UV_VALUE'] > 0:
entry = {}
entry['hour'] = extract_hour(d['DATE_TIME'])
entry['value'] = int(d['UV_VALUE'])
data.append(entry)
the_day = raw_data[0]['DATE_TIME']
pyportal.set_caption('UV Index for {0}'.format(extract_date(the_day)),
(80, 20),
0x000000)
number_of_readings = len(data)
whitespace = (number_of_readings - 1) * SPACE_BETWEEN_BARS + 2 * MARGIN
bar_width = (320 - whitespace) // number_of_readings
max_reading = max([d['value'] for d in data])
    while len(canvas) > 0:
        canvas.pop()

    for i, reading in enumerate(data):
        bar_height = (MAX_BAR_HEIGHT * reading['value']) // max_reading
        x = int(MARGIN + i * (bar_width + SPACE_BETWEEN_BARS))
        canvas.append(Rect(x, 200 - bar_height,
                           bar_width, bar_height,
                           fill=COLORS[reading['value']]))
        canvas.append(Label(bar_font,
                            x=x+3, y=220,
                            text=reading['hour'],
                            color=0x000000,
                            line_spacing=0.6))
        canvas.append(Label(bar_font,
                            x=x+(bar_width//2)-4, y=208-bar_height,
                            text=str(reading['value']),
                            color=0x000000))
time.sleep(3600) #refresh hourly