Chances are if you're programming firmware on a microcontroller you've had to do some 'fun' debugging. Button presses, interrupts, small memory spaces...it can make debugging quite a challenge! A lot of beginners lean on tried-and-true (if a little frustrating) printf statments or toggling GPIO's with LEDs on them. And don't get me wrong, those techniques work pretty well. But if you come from a software background you're probably used to really nice debugging setups, often built into the IDE

Of course its a ton easier to debug software when the computer is running both software and development platform. It's a lot tougher when the processor is physically separated, with its own memory, clocks, peripherals, and its not even of the same processor family!

No worries though, there's a full industry set up to create programming/debug dongles and adapters! One of our favorites is SEGGER's J-Link family. They're not cheap but they do support a vast number of chips.

Atmel also has it's own debugger chip, the EDBG (apparently its a AT32UC3A4256 programmed with Atmels proprietary firmware)

This chip comes on every Arduino Zero and is used to both program and debug firmware

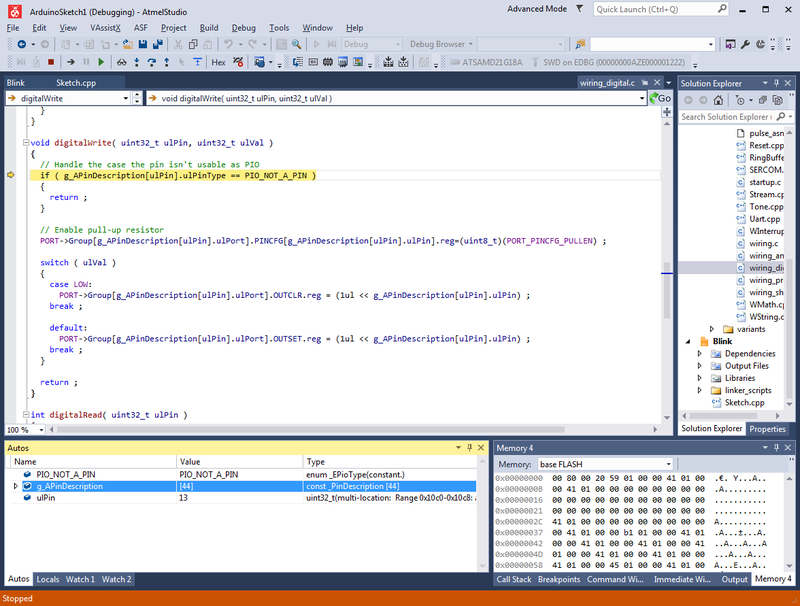
You may be wondering "OK so how do I actually do said debugging?" Well you've come to the right place because we're gonna show you how. In this guide we'll show how to debug the ATSAMD21 family (specifically the ATSAMD21G18) which is in the Arduino Zero and Feather M0 family, by using the EDBG or J-Link.

Before you begin you will need some software. Here's what we're using:

Arduino IDE

As of this writing, 1.6.7 is the latest so we're using that. We also installed the Arduino SAMD support and/or Adafruit SAMD support (for Feather M0)

Make sure you also have drivers set up for the board you're using, and get a sketch working and uploaded to the board. That means you have the IDE and package set up, which is something you want done before you continue

J-Link Software

If you're using a J-Link, install all software and drivers for it and run the J-Link commander to make sure you update the firmware, new firmware is constantly being released so best to update your 'Link!

Atmel Studio 7

Here's where the Mac and Linux people will be sad. This is the IDE software that can do step&memory debugging and its only for Windows. Also you have to make an account on Atmel's site, download it from here

Make sure you have the latest version, we used build 790

Note that by uploading a debug sketch you will blow away the bootloader on your Arduino Zero or Feather M0, see the next section for re-loading it!

OK now that we have all that software, the rest isn't too tough!

Load an Arduino Sketch in Atmel Studio 7

Start by launching Atmel Studio 7

Create a new Project

And select Create project from Arduino sketch

Navigate to your arduino sketchfolder and select the sketch. I recommend starting with the easy-to-understand Blink

Also select the Arduino IDE location if necessary. For Board go with Arduino/Genuino Zero (Programming Port) and under Device, ATSAMD21G18A

You'll see the following, where the sketch is in a window, you can edit the code here if you like. For now just leave it as is.

Set Up and Check Interface

OK next up we'll attach the chip & debugger. You have two options:

Arduino Zero Debug port

This is super easy, just connect a USB micro B cable to your Arduino Zero

Make sure you're plugged into the DEBUG port not the 'native' port

J-Link to SWD

If you have a board without an EDBG chip on it, you can still debug, but you'll need a helper such as a J-Link. We like using this handy adapter board

To get the large J-Link cable do the 'classic' 2x5 SWD cable connector

If you are debugging a board that doesn't even have an SWD connector on it, you may need to solder to the SWD pads

You need to connect the following to the J-Link:

  • Vref / Vtarget - Logic voltage of the chip, in this case 3.3V
  • GND to common ground
  • SWDIO to SWDIO
  • SWCLK to SWCLK

I haven't found I need to connect the chip's RESET line

Identify Interface

OK now you have your debugger plugged in, its good to check that it works, select Device Programming

Under Tool make sure you can select EDBG or J-Link

Select ATSAMD21G18A as the device, SWD as the interface and hit Apply

You can then Read the Device Signature. Make sure this all works before you continue!

If you are asked to update the J-Link or EDBG firmware, its OK to do so now.

Build & Start Debugging

OK close out the modal programming window, we dont need it for now. Build the program

Add a Break by clicking on the first DigitalWrite function call, you'll see a red dot

Now run Start Debugging and Break

Note that by uploading a debug sketch you will blow away the bootloader on your Arduino Zero or Feather M0, see the next section for re-loading it!

You'll get prompted to select a debugging tool

Go thru what you did before, selecting the programmer and processor

Once done go back and re-run Start Debugging

You'll end up in a strange code, labeled int main(void) { this is the main entry point to the sketch. Normally this part is never seen, it's what sets up the Arduino before you get to the setup section of the sketch!

Select Continue to skip ahead to your stopping point

Now you'll end up at that DigitalWrite with the red dot. Note that you stop right before this gets run.

Now select Step Over to execute that line. Since you're in step-debugging mode you'll have to Step each function call you want to run. If you just want to continue running the code without any delays or steps, click on Continue like you did before

You can also dig deeper into a function with Step Into

This will let you go into the function call, to see what goes on inside. You can then continue to step over, step in or step out (complete the function)

You can also see variable names below, and the entirety of memory. Since this is just a basic tutorial we wont go into the vast depths of debugging, stack traces, and memory twiddling!

There's a ton more details on the Atmel Studio documentation page

Fixing other errors

Thanks to dgube1 in the forums for running into and finding a fix for this one. Read the post here for more details.

If you are getting a bunch of errors when you try to build the solution, you may need to remove the "math_helper" source files from the project. In the Solution Explorer (see below):

  • Remove math_helper.h from ArduinoCore/include/core
  • Remove math_helper.c from ArduinoCore/src/core

And hopefully that will help.

C and C++ compilers make your code better when they compile it! This is great, but when we are trying to debug our code we don't want anything to change it.

If you try to use the debugger and you see that it doesn't move from one line to the next as you would expect, this is because you have compiler optimizations turned on.

to turn them off, right click on the ArduinoCore project in the Solution Explorer pane, and click properties.

Then under Toolchain, go to the ARM/GNU C Compiler heading and click Optimization. Set Optimization Level to None (-O0).

Then do the same thing under the ARM/GNU C++ Compiler heading.

Then save your project.

Now, repeat the above steps to turn off compiler optimizations for the other project (whatever you have named your sketch) in the solution explorer.

There should be two projects in the Solution Explorer pane. ArduinoCore, and whatever you have named your sketch. Make sure you have done the above steps to turn off compiler optimizations on both projects in the solution explorer pane.

Correcting Paths to Necessary Files

Current versions of Arduino have changed the location of the CMSIS core files that are necessary to compile projects.

We can fix these paths by going back to the Properties pane (by right clicking on the project in Solution Explorer and selecting Properties as we did before) and under ARM/GNU C Compiler select Directories and add the new path to the CMSIS core files to the Include Paths section.

This can be done by clicking the green plus button, and then finding the folder by clicking the ... button in the window that pops up.

Leave the Relative Path box checked.

The current location of the CMSIS core as of the writing of this guide is:

C:\Users\YourNameHere\AppData\Local\Arduino15\packages\arduino\tools\CMSIS-Atmel\1.1.0\CMSIS\Device\ATMEL

Then select the path you just added in the list and click the yellow up arrow icon to move it to the top of the list.

Now repeat those same steps in the Directories pane under the ARM/GNU C++ Compiler section. 

Do these steps for both projects in the Solution Explorer pane.

Make sure you have done the steps under the "Correcting Paths To Necessary Files" heading for both projects in the Solution Explorer pane.

Fixing Some Core Files

If you try to debug your sketch now, it may warn of an "undefined referenced to `vtable for HardwareSerial'"

To fix this, open the includes/core/HardwareSerial.h file under the ArduinoCore project.

Scroll down to the class definition around line 67 and replace the class declaration with the following code:

class HardwareSerial : public Stream
{
  public:
  
	HardwareSerial() {};
	virtual ~HardwareSerial() {};
  
    virtual void begin(unsigned long) {};
    virtual void begin(unsigned long baudrate, uint16_t config) {};
    virtual void end() {};
    virtual int available(void) = 0;
    virtual int peek(void) = 0;
    virtual int read(void) = 0;
    virtual void flush(void) = 0;
    virtual size_t write(uint8_t) = 0;
    using Print::write; // pull in write(str) and write(buf, size) from Print
    virtual operator bool() = 0;
};

Your file should look like this:

Once this is done, you should be able to compile and debug your sketch!

When you program in for debugging you are writing direct to the chip, this deletes the bootloader! You'll want to restore it if you ever want to go back to using the Arduino IDE.

Arduino Zero

This is pretty easy. Launch the IDE, select Arduino Zero (programming port) from the Tools->Board menu, and Atmel EDBG as the Tools->Programmer

Then select Burn Bootloader

It only takes a few seconds to burn in the bootloader:

Feather M0 or Others

For this, you'll need to use the Atmel Studio setup, since you're using a J-Link.

Download the bootloader hex file

Wire it up correctly and select Device Programming

Select J-Link and the ATSMD21G18A with SWD. Verify you can read the Device Signature

Unlock the Bootloader protection by going to Fuses and changing BOOTPROT to 0x07 then programming

Next click on Memories in the left hand side

Next to the Flash (256 KB) section, click the triple-dots and select the bootloader file.

Then click Program to program it in

This guide was first published on Feb 25, 2016. It was last updated on Mar 08, 2024.